
1. Project Overview
Clinical Biomarker Data Reconciliation Analysis
This project analyzes a simulated clinical biomarker dataset to identify missing samples, shipment delays, and inconsistencies between subject visit records and laboratory sample tracking data.
The analysis demonstrates how SQL queries and data visualization tools can be used to investigate operational issues commonly encountered in biomarker-driven clinical trials.
Tools Used: SQL, Excel, Power BI, Data Cleaning, Data Visualization
2. Business Context
In clinical trials, biospecimen data is often tracked across multiple systems including laboratory LIMS systems, shipment manifests, and sponsor-provided datasets. Discrepancies between these sources can lead to missing samples, incorrect subject visit mapping, or delays in biomarker analysis.
This project demonstrates how SQL queries can be used to investigate these discrepancies and generate operational metrics that help clinical teams monitor sample completeness and laboratory performance.
3. Dataset Description
The dataset represents a simplified clinical trial biomarker sample tracking system. Each row corresponds to a biospecimen sample associated with a subject visit at a clinical site.
The data includes key operational fields used to monitor sample collection, shipment logistics, laboratory receipt, and biomarker result reporting during a clinical study.
Key fields include:
• sample_id – Unique identifier for each biospecimen sample
• subject_id – Clinical trial subject identifier
• site_id – Clinical site where the sample was collected
• visit_number / visit_date – Scheduled study visit when the sample was expected
• collection_date – Date the biospecimen was collected at the site
• ship_date – Date the sample shipment was sent to the laboratory
• ship_delay_days – Calculated delay between collection and shipment
• temp_excursion_flag – Indicates whether the sample experienced temperature deviation during transport
• protocol_deviation_flag – Indicates whether the sample handling deviated from protocol requirements
• lab_received_date – Date the central laboratory received the sample
• lab_result_date – Date the biomarker result was reported
• lab_tat_days – Laboratory turnaround time in days
• sample_status – Final status of the sample

4. SQL Analysis
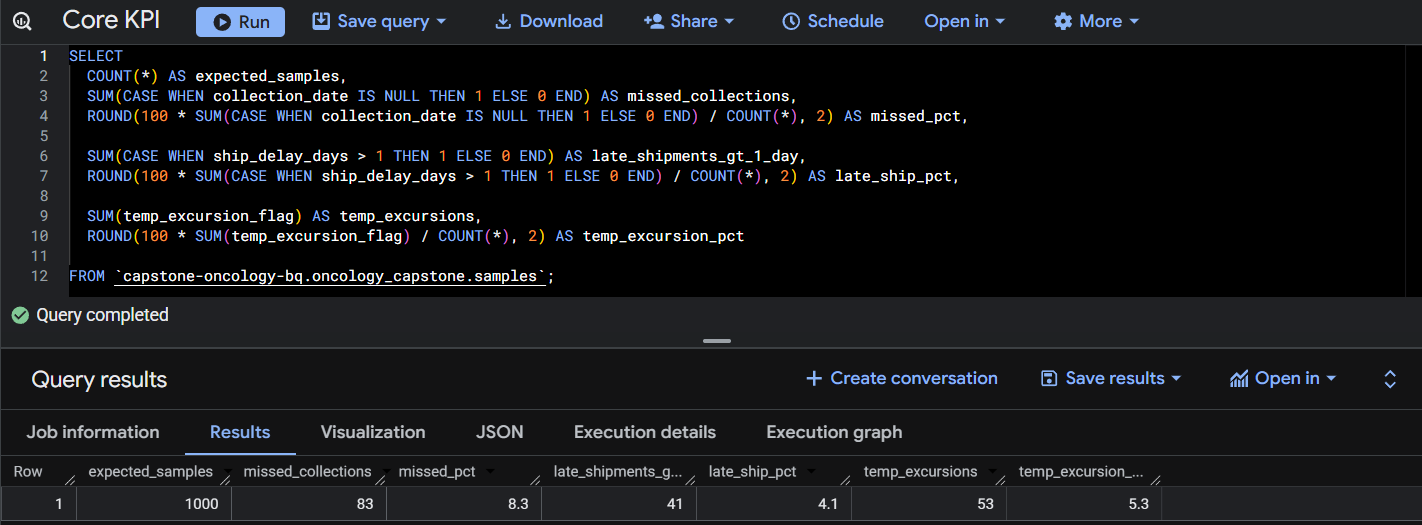
Query 1: Core Operational Metrics.
This query calculates core study-level operational metrics including expected samples, missed collection rate, late shipment rate, and temperature excursion rate.
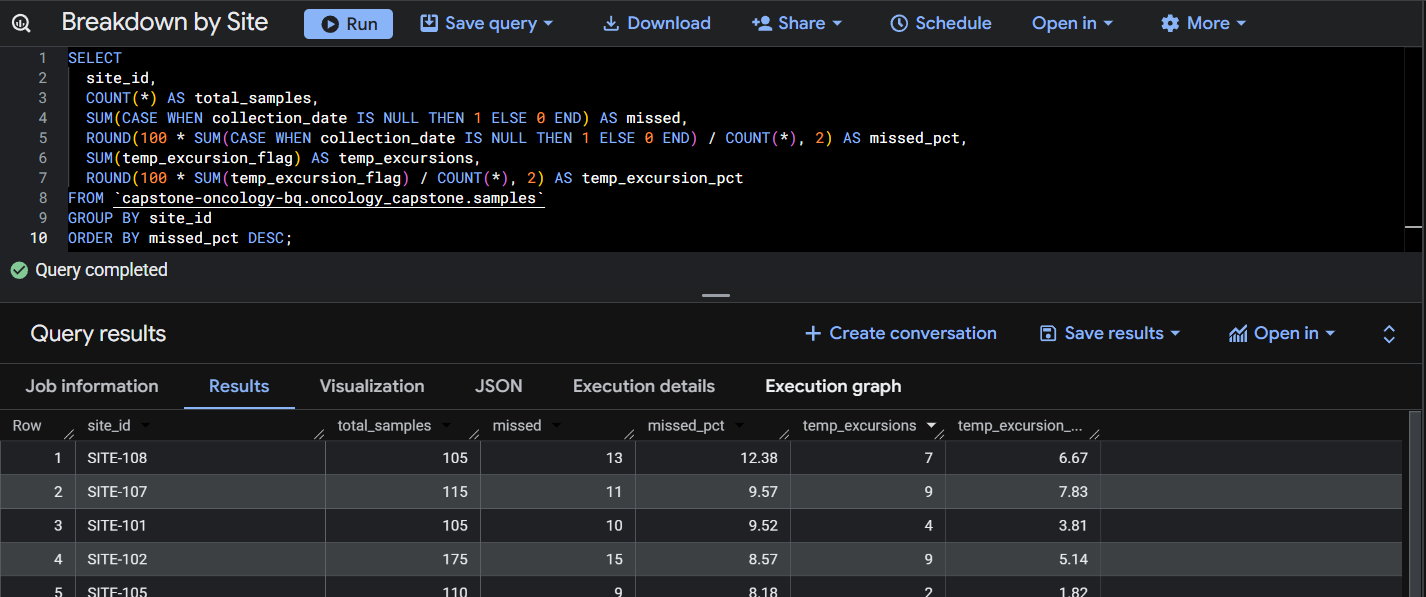
Query 2: Breakdown by Site.
This query summarizes total samples, missing collections, and temperature excursion rates by site to identify operational risk areas.
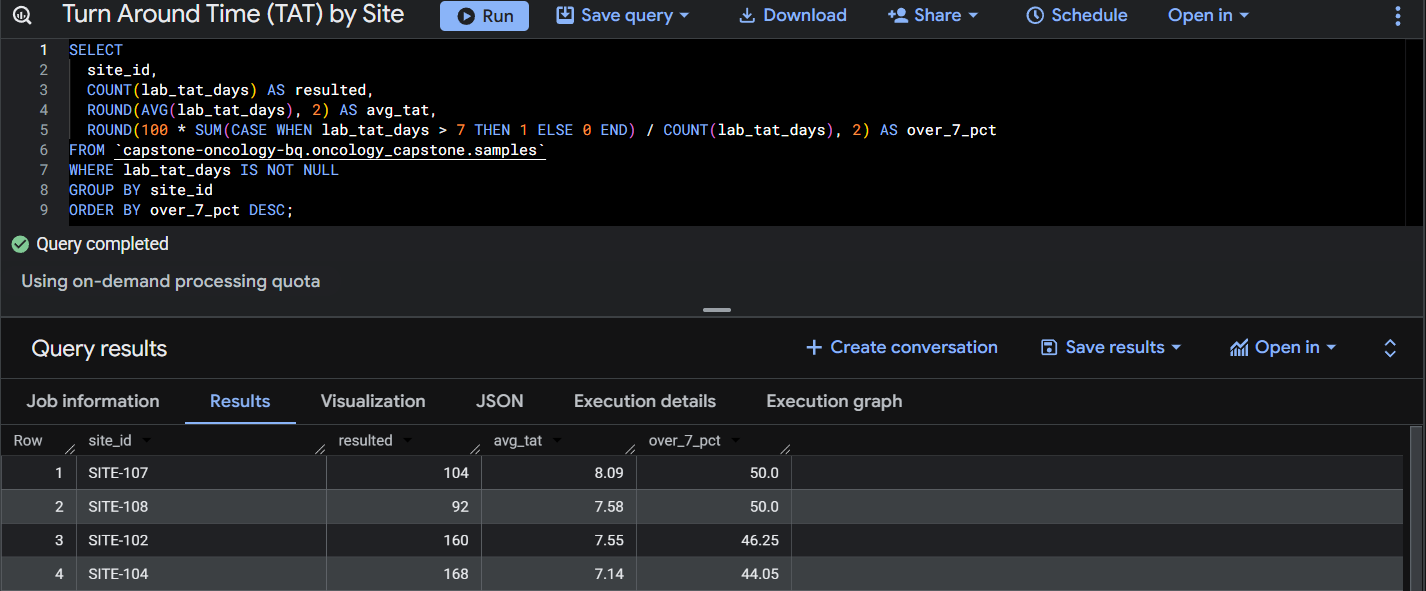
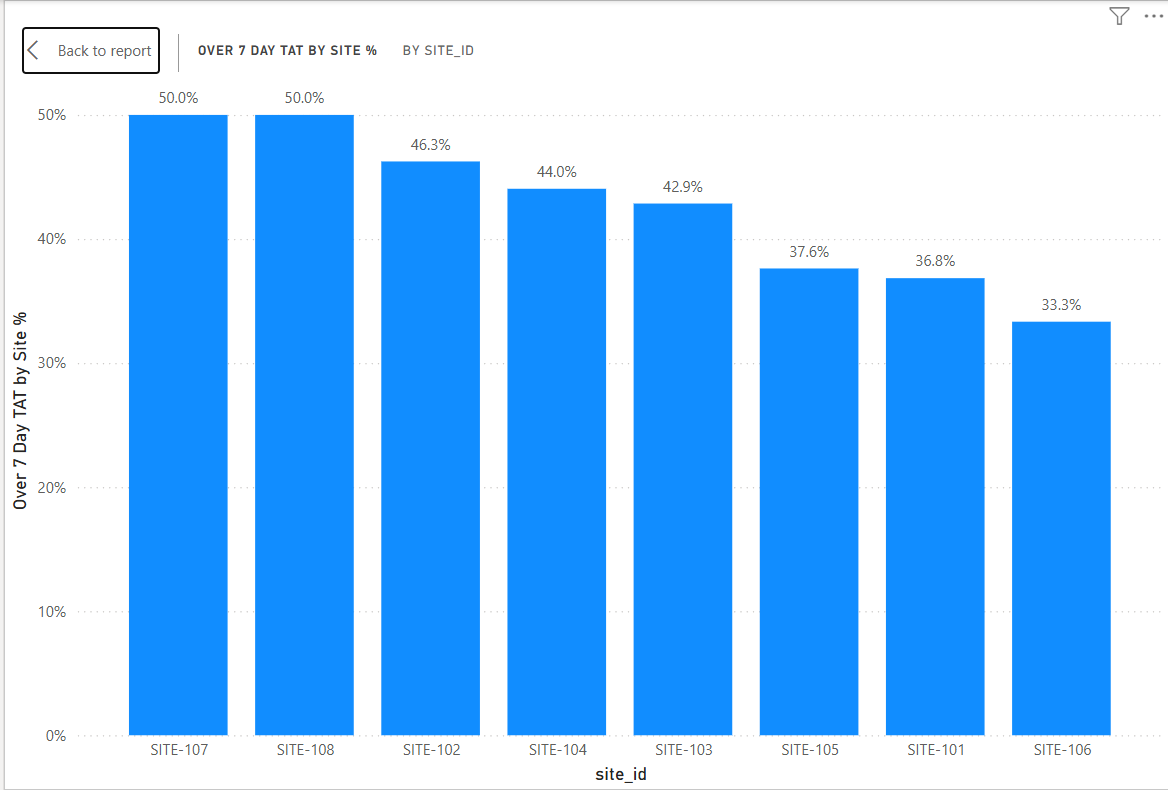
Query 3: Turn Around Time (TAT) by Site.
This query calculates average laboratory turnaround time and the percentage of samples exceeding seven days by site.
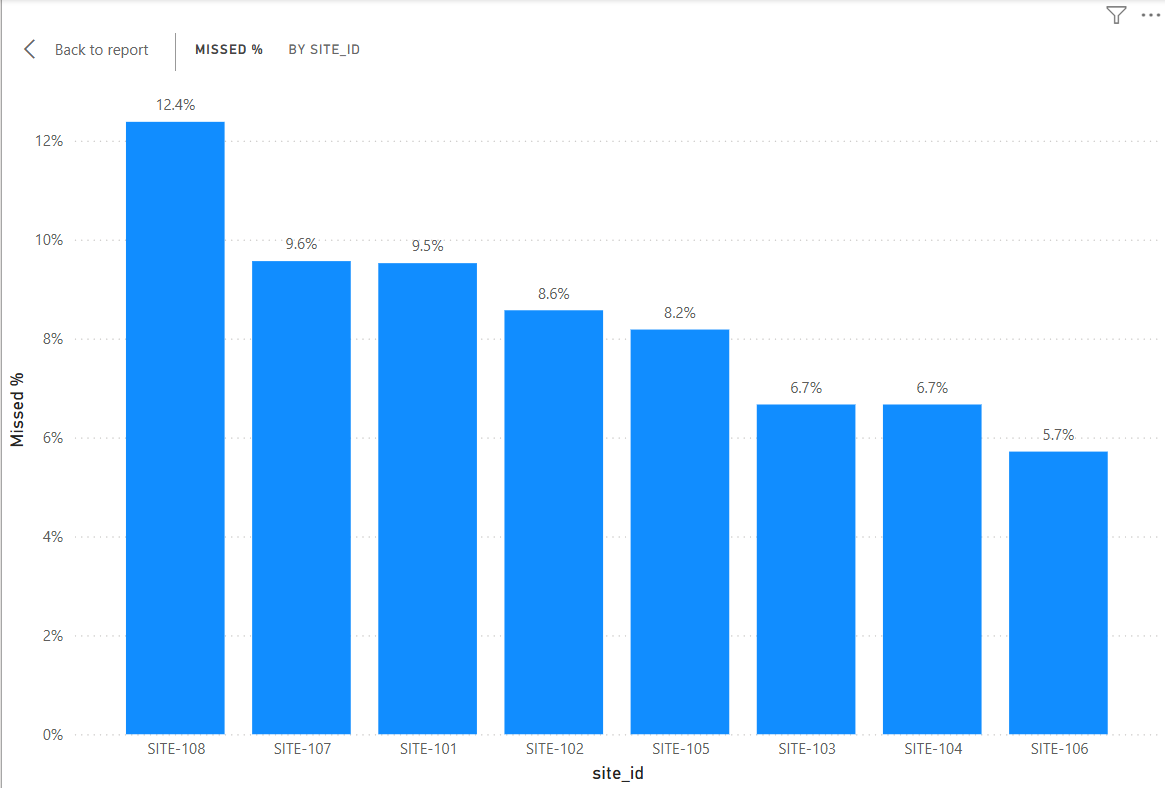
5. Operational Dashboard (Power BI)
Power BI dashboards were created to summarize operational performance across clinical trial sites, including sample collection quality, shipment timelines, and protocol adherence.

6. Key Findings
Sample Collection Completeness
The analysis identified that 8.3% of expected biomarker samples were missing across the dataset. Site-level analysis showed variation in collection performance, with some sites exceeding 12% missing sample rates, suggesting inconsistent sample collection procedures.
Shipment Turnaround Delays
Approximately 43% of samples exceeded a 7-day laboratory turnaround time, indicating potential delays in sample shipment or laboratory processing. Site-level variation suggests that logistics performance may differ across clinical sites.
Temperature Excursions
Temperature excursions occurred in 5.3% of shipments, indicating that a subset of samples may have experienced environmental conditions outside protocol requirements during transport.
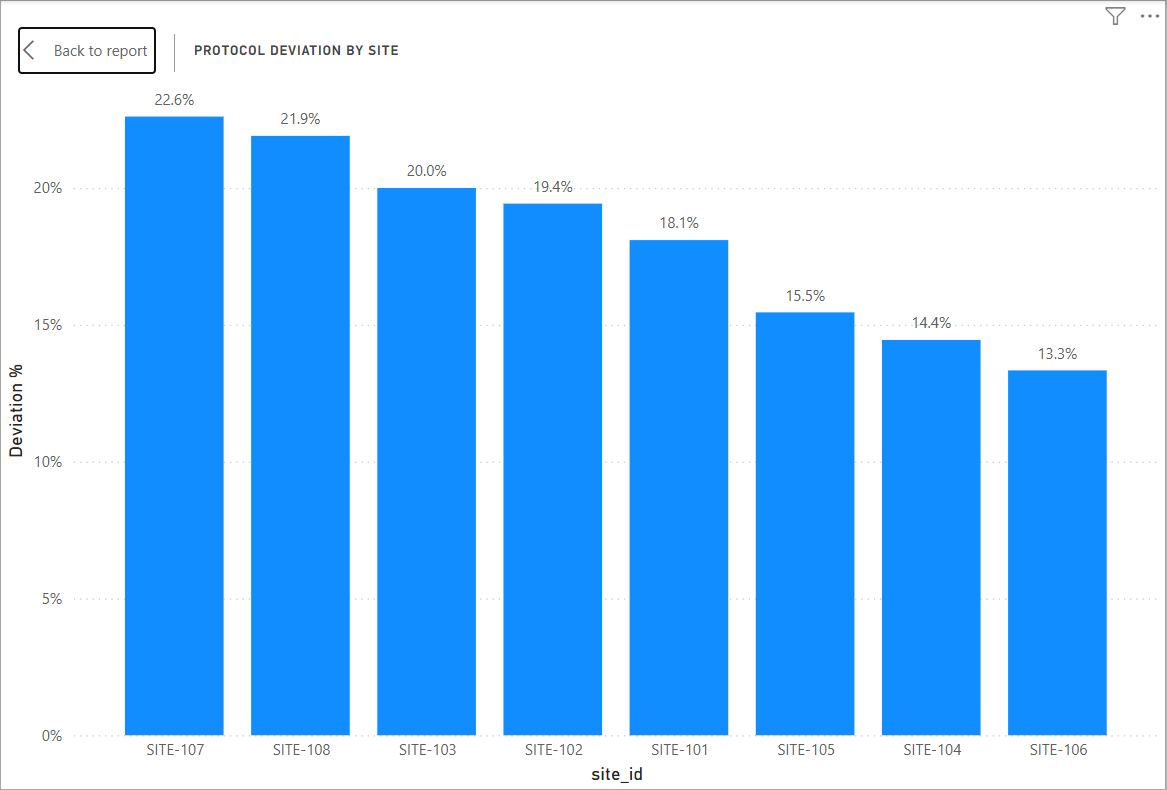
Protocol Deviations
Protocol deviations were observed in approximately 18% of samples, with certain sites demonstrating higher deviation rates. This may indicate site-level differences in protocol adherence or operational training.
Operational Monitoring Value
These findings demonstrate how SQL-based analysis and operational dashboards can be used to monitor study execution, identify high-risk sites, and support proactive investigation of sample handling or shipment issues during a clinical trial.